Mon premier projet cloud
Ce projet vient d’une prompte donnée a chatGPT lui demandant les meilleurs projets pour 3 disciplines données (systèmes, réseaux et cloud computing).
Perfect. You’re the student, I’m the guide. I won’t give answers—just direction—unless you ask for them. Here’s your learning roadmap, step by step.

---

### 🧭 PHASE 1: Environment Setup – *"Build your lab."*

1. **Pick a Cloud Provider**: Choose between AWS EC2, DigitalOcean, etc.

   * *Goal*: Launch a basic Linux VM (Ubuntu recommended).
   * *Checkpoint*: You can SSH into the VM from your local machine.

2. **Prepare the VM**:

   * Install Python (`python3`, `pip`)
   * Set up basic security (e.g., ufw, fail2ban)
   * Create a non-root user with `sudo` access
   * Keep system updated (`apt update && apt upgrade`)

📍*Once you can run Python scripts on your cloud VM, move on.*

---

### 🔧 PHASE 2: Build the Monitoring Script – *"Make your sensor."*

1. **Choose What to Monitor**:

   * Use `ping` for network health
   * Use `traceroute` for latency paths
   * Use `psutil` for CPU, memory, disk

2. **Script in Python**:

   * Modularize: one function per type of check
   * Time your script with `cron` (every 5 mins?)

3. **Send Alerts**:

   * Use `smtplib` for email
   * Or Telegram Bot API for Telegram messages
   * Set conditions: e.g., "if ping > 100ms, then alert"

📍*Once your script runs via cron and sends alerts, you're solid.*

---

### 📊 PHASE 3: Optional Bonus – *"Turn it into a cockpit."*

1. **Learn InfluxDB**:

   * It’s a time-series database
   * Start with local install on your VM
   * Structure: measurement → tags + fields + timestamp

2. **Learn Grafana**:

   * Grafana pulls from InfluxDB
   * Build dashboards: charts for CPU, latency, etc.

3. **Integrate**:

   * Modify your Python script to write data to InfluxDB
   * Set Grafana panels to visualize it

📍*This turns your basic script into a real-time visual dashboard.*

---

### 🔁 PHASE 4: Iterate – *"Polish your tool."*

* Add logging to your script
* Support multiple hosts
* Add authentication to Grafana
* Optimize security and resource usage

---

At every step: **build, test, break, fix.**
When you get stuck, **ask me to zoom in**, and I’ll give help.

Ready for Phase 1?
C’est donc un processus par phase.
Phase 1 : “Build your lab”
J’ai donc commencé par digitalOcean car rentable en tant qu’étudiant, avant de prendre une VM avec des specs modeste:
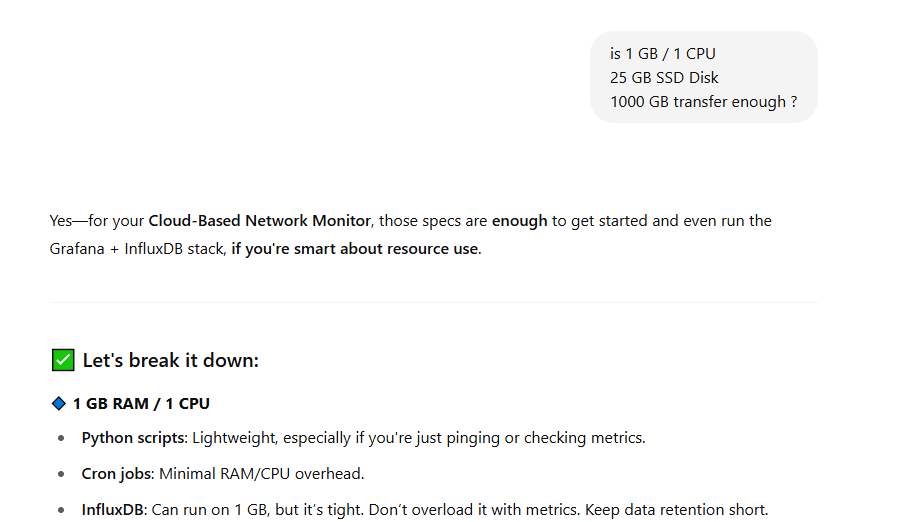
Yes—for your **Cloud-Based Network Monitor**, those specs are **enough** to get started and even run the Grafana + InfluxDB stack, **if you're smart about resource use**.

---

### ✅ Let's break it down:

#### 🔹 **1 GB RAM / 1 CPU**

* **Python scripts**: Lightweight, especially if you're just pinging or checking metrics.
* **Cron jobs**: Minimal RAM/CPU overhead.
* **InfluxDB**: Can run on 1 GB, but it’s tight. Don’t overload it with metrics. Keep data retention short.
* **Grafana**: Low load if you’re the only viewer. One dashboard, not 20.

> **Tip**: Use swap space (`/swapfile`) to cushion memory pressure.

---

#### 🔹 **25 GB SSD**

* Base Ubuntu: \~2–3 GB
* Python & tooling: < 1 GB
* InfluxDB + Grafana: \~500 MB initial, \~few GB over time
* Logs and data: depends on how frequently you store and for how long

> **Tip**: Use log rotation. Trim old InfluxDB data regularly.

---

#### 🔹 **1000 GB Transfer**

* This is **plenty** unless you're pinging 100+ external servers 24/7 or streaming dashboards to many users.

> **Tip**: Monitor outbound traffic if your host has bandwidth alerts.

---

### 🧭 Verdict:

**✅ Good for learning + prototyping + small-scale deployment.**
If you later monitor *many* hosts or have *high-frequency* metrics + dashboard viewers, consider upgrading to 2 GB RAM.

---

Want me to suggest a cheap DigitalOcean or AWS config that fits this?
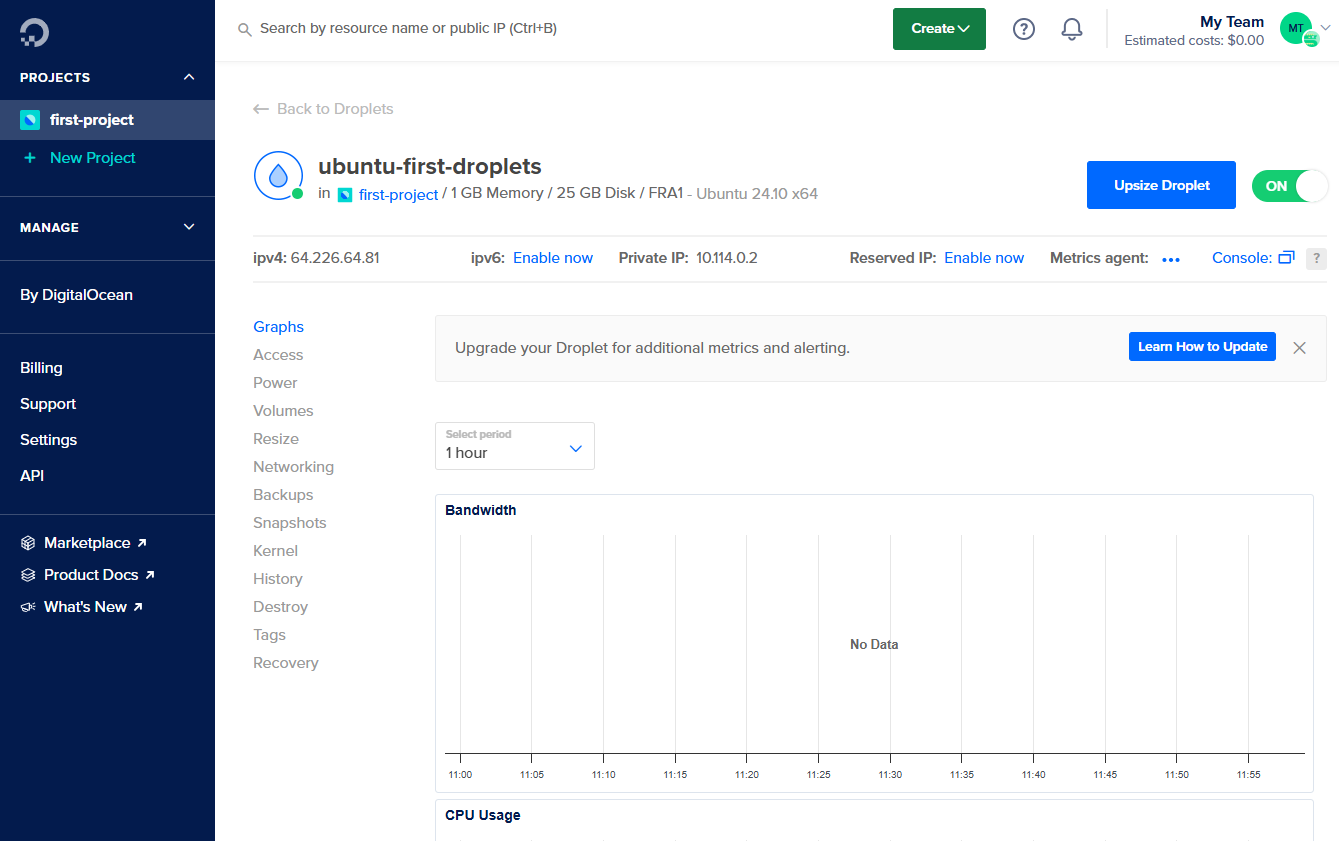
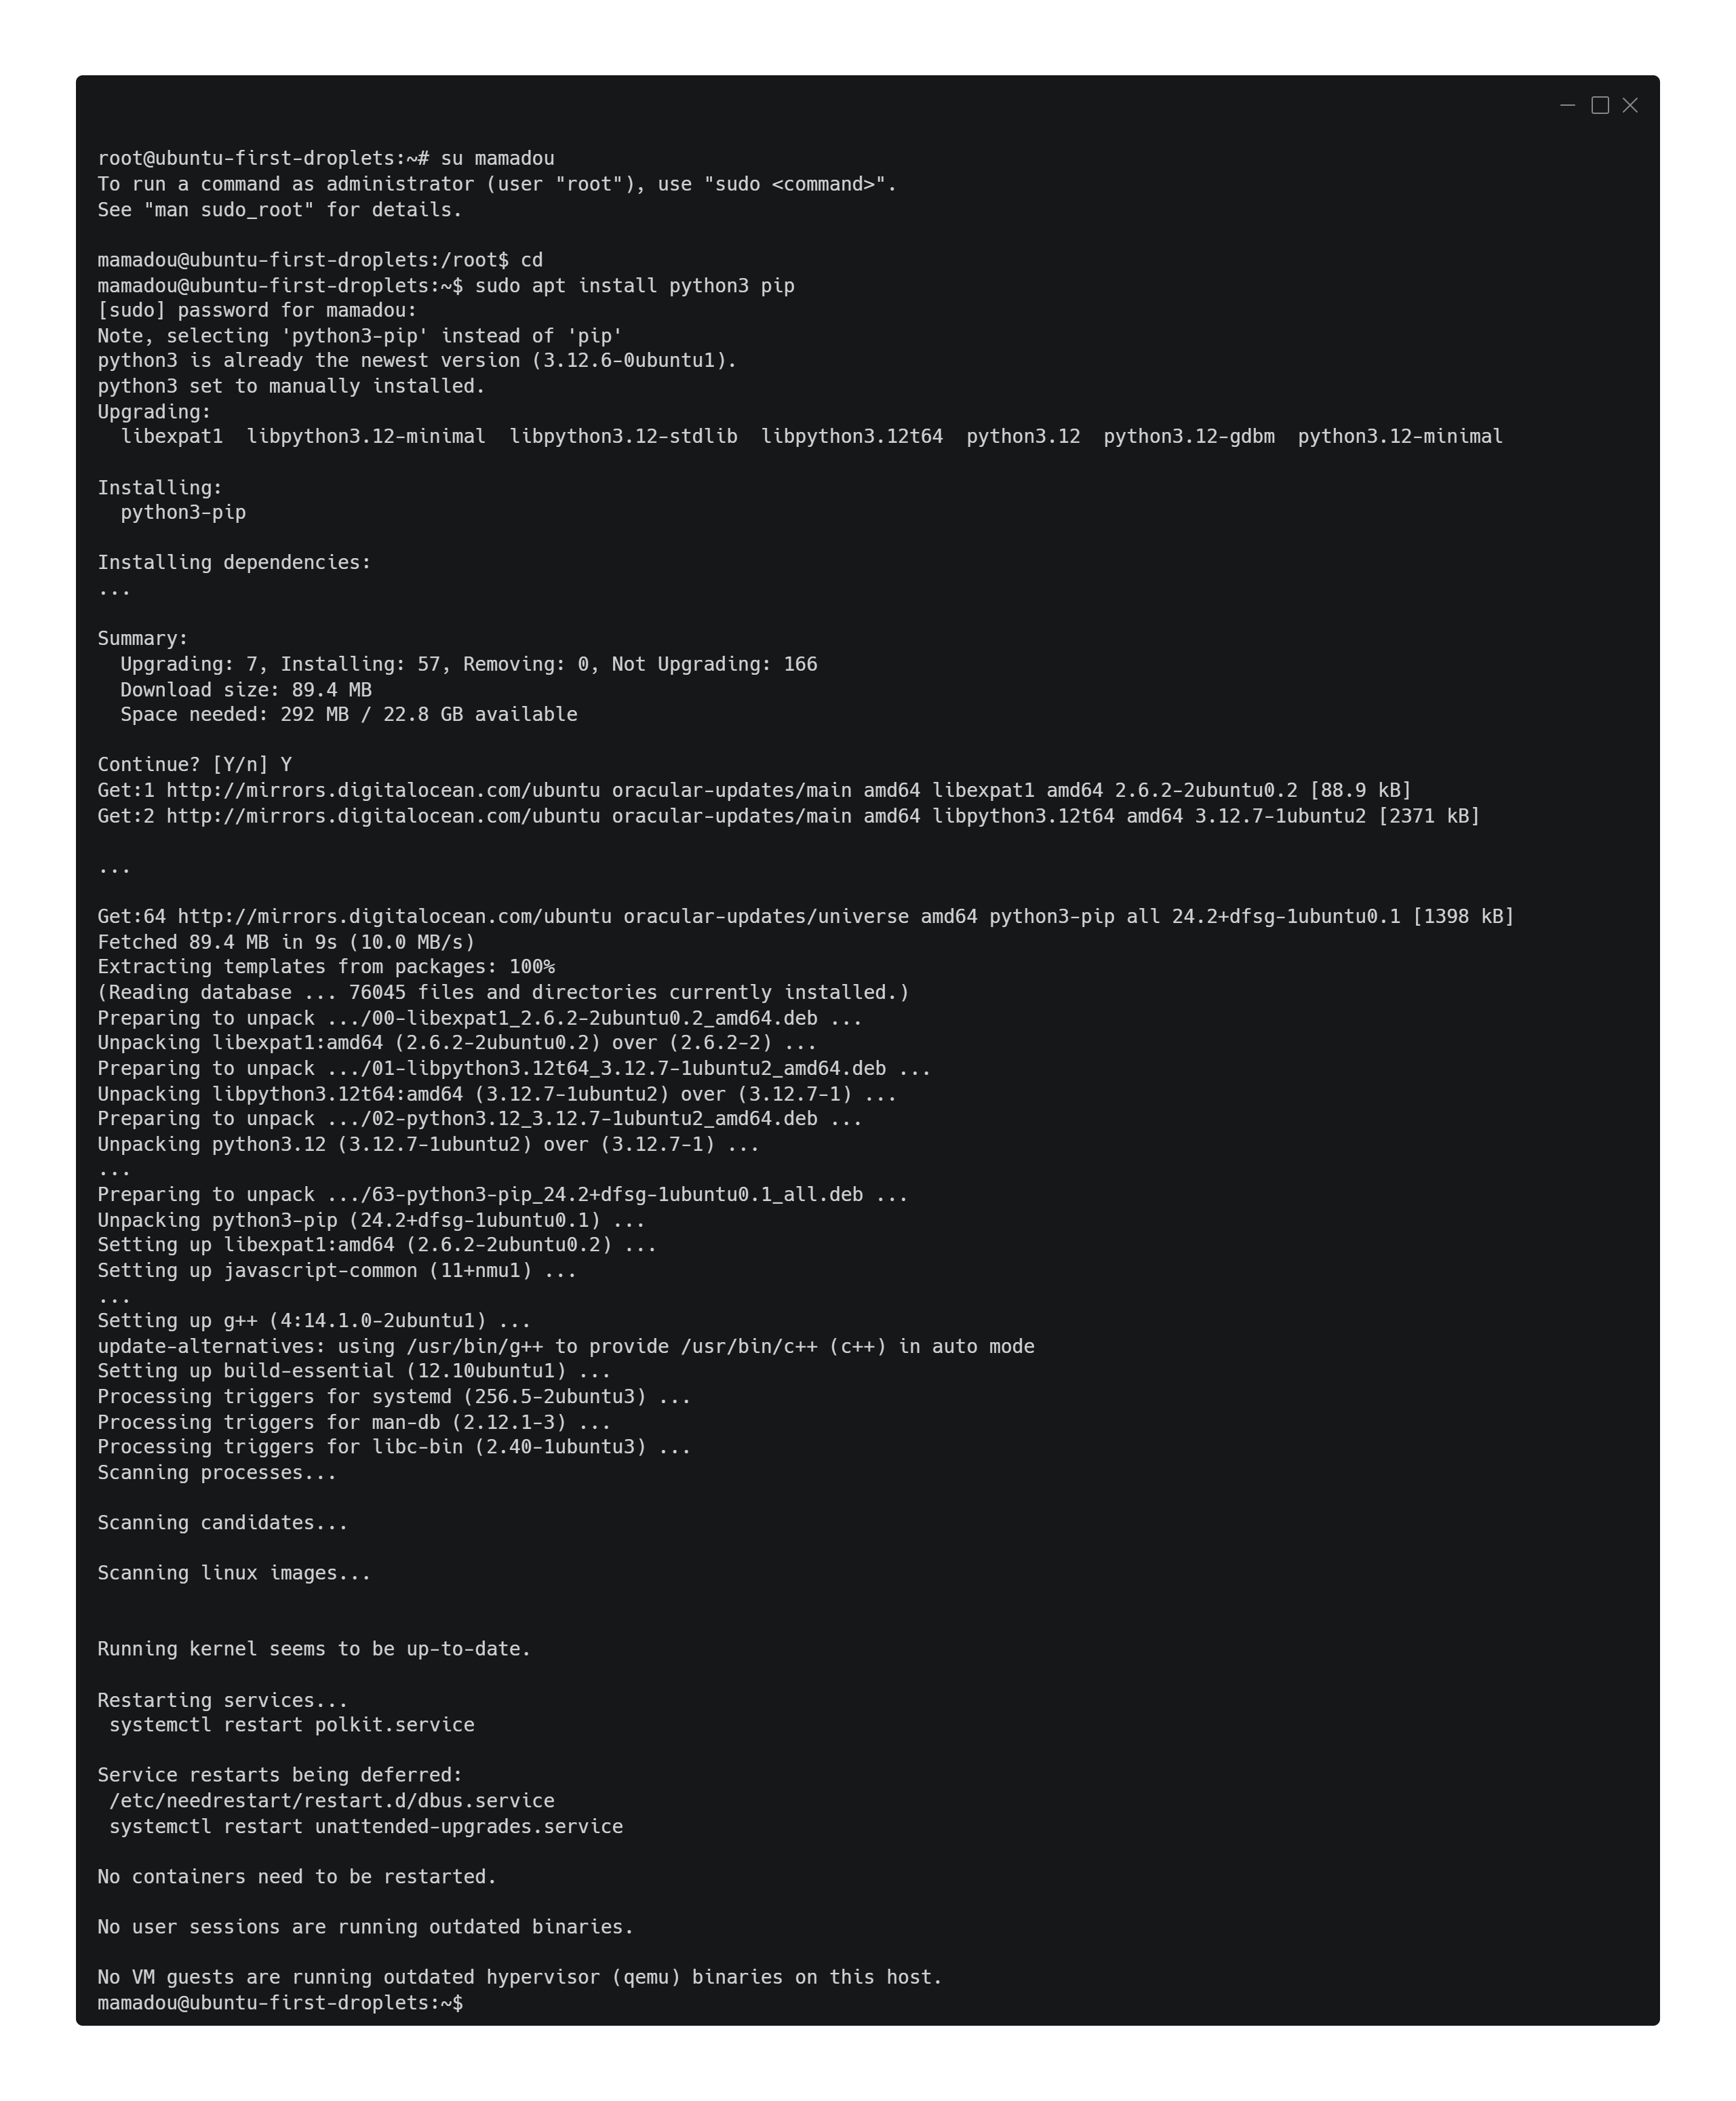
Maintenant que le droplet (machine virtuelle sur digitalOcean) est prêt, on passe à la console.
On crée un utilisateur “régulier” pour des raisons de sécurité (dans le groupe sudo).
adduser mamadou
usermod -aG sudo mamadou
Ensuite on installe python3+pip:
Avec ma méthode de prompte par direction, il m’en dit plus sur comment configurer la sécurité sans me donner la réponse.
Ø	Set up basic security (e.g., ufw, fail2ban)
Perfect. You're now entering Phase 2: Secure the Perimeter—before anything runs on the VM, make sure it's protected.
🛡️ Step 2: Set Up Basic Security
🔒 Your Objectives:
·	Configure a basic firewall to limit unwanted traffic.
·	Install fail2ban to protect against brute-force attacks.
🧭 Direction Only — Here's what to research and do:
1. Configure UFW (Uncomplicated Firewall)
·	What command enables UFW?
·	Which ports do you need open for SSH and (eventually) email or web dashboards?
📝 Checkpoint: UFW is enabled and allows only the ports you need.
2. Install and Configure Fail2ban
·	How do you install it on Ubuntu?
·	What does the default config protect? Where are logs stored?
·	How do you make custom jail settings (e.g., for SSH)?
📝 Checkpoint: Fail2ban is active and jailing suspicious SSH attempts.
💡 Tips:
·	Remember to test SSH access after enabling UFW.
·	Fail2ban works by watching log files—what kind of logs does it read?
📣 When you're done, or if you get stuck, tell me what you've tried or ask for a hint.
Firewall avec ufw
sudo apt install ufw
sudo ufw enable
sudo ufw delault deny incoming
sudo ufw delault allow outgoing
Le parefeu par défaut est maintenant configuré !
ufw allow ssh
On active le port 22 (SSH) seulement, dans la mesure où c’est le seul dont on a besoin.
Configurer Fali2ban
sudo apt istall fail2ban
Fail2ban scans log files (e.g. /var/log/httpd/error_log) and bans IPs that show the malicious signs like too many authentication attempts, scanning for vulnerabilities, etc. Generally Fail2ban is then used to update firewall rules to reject the IP addresses for a specified amount of time, although any other arbitrary action (e.g. sending an email) could also be configured. https://wiki.archlinux.org/title/Fail2ban
Ne voyant pas d’inconvénient à la configuration par defaut, j’ai décidé de ne pas créer de configuration local.
1ére connexion SSH
On cherche l’IP publique avec:
ip addr
pour ensuite s’y connecter avec un ordinateur externe au systéme avec la commande ssh:
ssh -p 22 mamadou@xyza
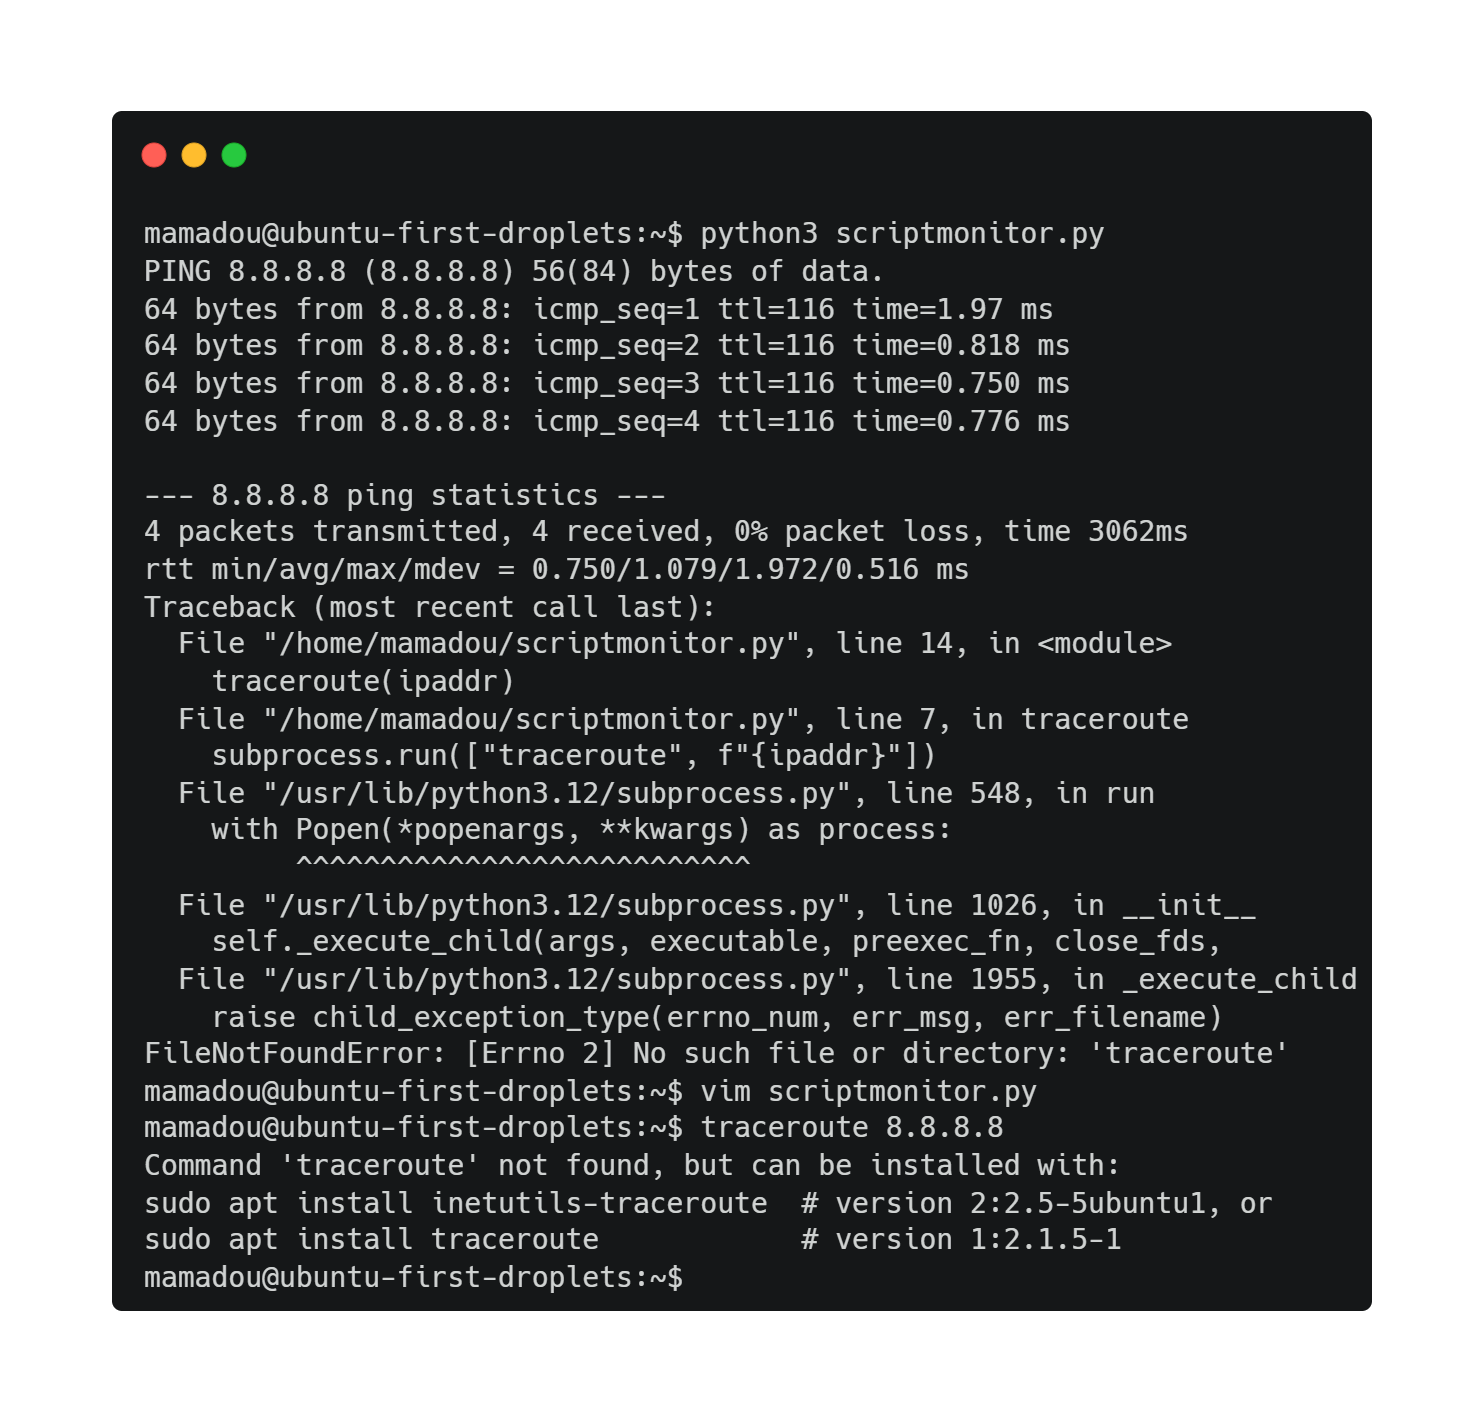
Phase 2 : “Make your sensor”
W.I.P
En conclusion
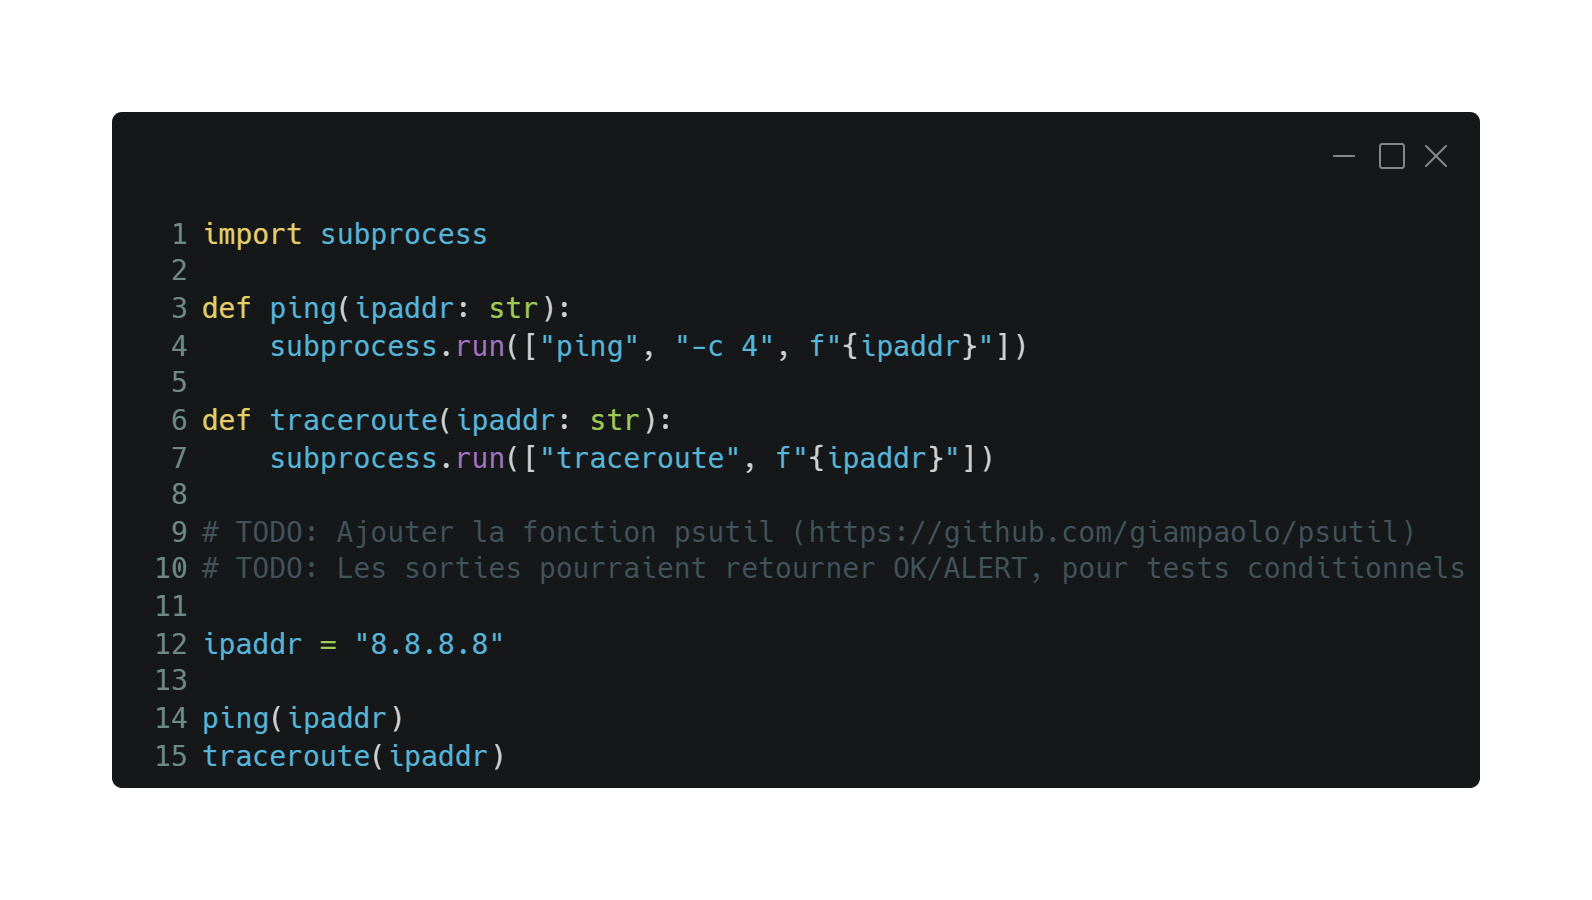
Ce projet est un cours de finition, je n’ai pas encore automatisé les lancements avec cron, sans compter qu’il est compliqué de faire des tests conditionnels sans des variables de retours claires (OK/ALERT). Enfin le module psutils n’est pas utilisé ici. Je suis malgré tout très satisfait de ma première expérience avec le cloud computing, et espère reprendre ce projet dans les plus brefs délais. J’envisage d’ailleurs de transférer ce/ces postes correspondants dans une section à part entière (Ex : portfolio). Merci de m’avoir lu.